
Every year, just before the season begins, writers publish their annual list ranking the best players going into the season. These list encourage debate amongst NBA fans from all over. Opinions like “Curry is better than Durant” or “Why is Rose ranked so low this year”, these list elicit both positive and negative responses. So the question I asked do these list matter in terms of predicting success? and if so which ranking site is the most accurate?
I collected samples from three prominent basketball websites; ESPN, CBS, and Sports Illustrated. I used the past two seasons for collecting the data (2014-2015, and 2015-2016). The reason for only two seasons is incomplete data. It was hard to find data comparing the three websites across multiple seasons, thus two seasons of data were used. From here I used the top 35 players from each ranking site. I felt 35 players was a large enough sample size for this blog entry. 35 players ensure that the list are not entirely similar across the three sites, and 35 is enough to ensure a low chance of the data being skewed by outliers (ie player injuries).
The next step was deciding how to measure success. Since this is on an individual level, I decided to use two metrics; Value Over Replacement Player(VORP), and Player Efficiency Rating (PER). PER is a metric created by John Hollinger back the late 80s. The tl;dr version of the stat is it measure per minute productivity by summing the positive plays with the negative plays (for full calculation visit here). Some of the positives of PER is that it is pace adjusted and minute adjusted. This means that slower teams (ie the Spurs) are measured the same as fast teams (ie the Warriors). The per minute basis allows fair comparison for starters and bench players. PER, like every stat, is not perfect. It favors high usage players, and does not value defensive players as much. VORP measures how much value a specific player provides compared to the average player. Essentially, VORP is a crude estimate to determine how valuable a player is. A replacement player provides a VORP of -2. The calculation for VORP is [BPM – (-2.0)] * (% of minutes played)*(team games/82), for a full in depth breakdown of VORP visit here. I believe a combination of these two metrics can shed some light on determining the success of a player, and measuring their value.
A linear regression model was used to determine which ranking site was the most accurate predictor of success. r^2 tells us how much the dependent variable is related to the independant variable. In this case, the ranking is the independent variable (X axis), and the performance of the player (VORP and PER) is the dependent variable (Y axis). As r^2 grows closer to 1.0 the correlation increases. In other words, the higher the number the more correlated pre-season rankings and success (PER, VORP) are.
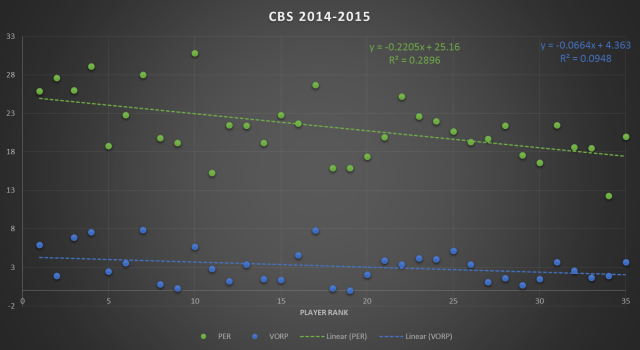
CBS 2014
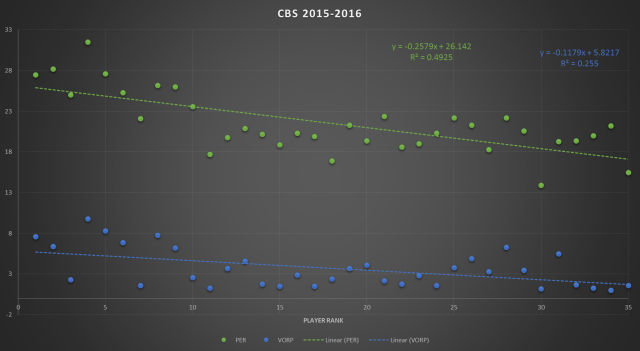
CBS 2015
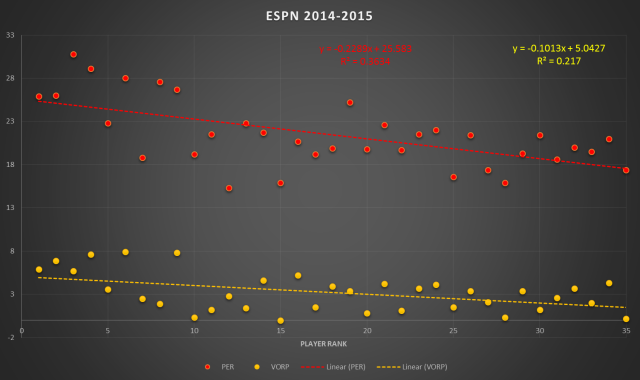
ESPN 2014
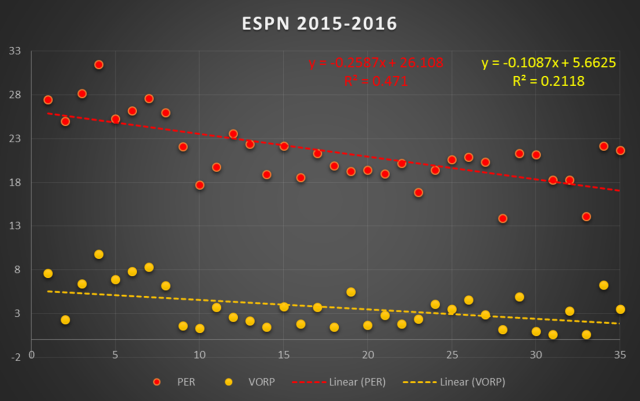
ESPN 2015
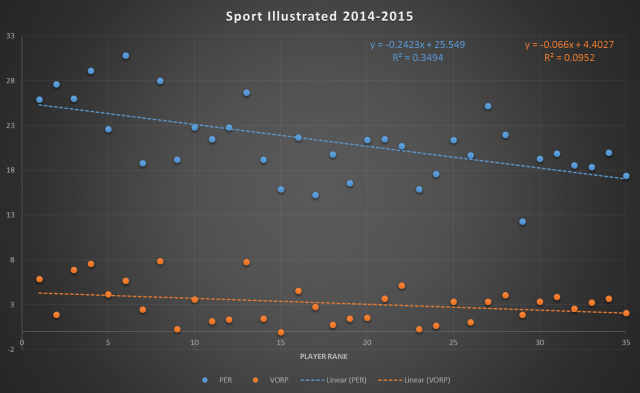
Sports Illustrated 2014
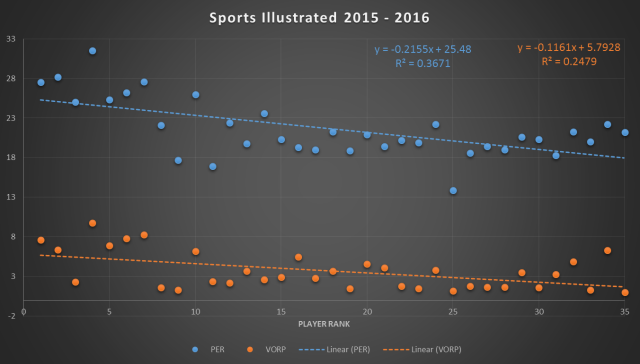
Sports Illustrated 2015
The most accurate single year was CBS in 2015-2016, as the r^2 was the highest for both VORP and PER. However, ESPN was consistently the best predictor of player performance over the two seasons across both metrics.
The slope of the line tells us how a player is intended to perform given their ranking. The player who overperformed (according to player rank) the most in 2014-2015 was Anthony Davis (PER), and James Harden (VORP), this was the same case across all sites. For 2015-2016 Stephen Curry over performed in PER, and VORP (again across all sites). The players who underperformed according to their rankings in 2014-2015 was Joakim Noah (PER) (Sports Illustrated, ESPN), and Andre Iguodala (PER) (CBS). As for VORP, it was Dwight Howard. In 2014-2015 it was Marc Gasol (ESPN, CBS) (PER) and Tim Duncan (Sports Illustrated) (PER). As for VORP the low performers were Marc Gasol (ESPN, Sports Illustrated), and Blake Griffin (CBS).
So what does this all mean? To be honest, not much. At best the correlations are weak to medium depending on one’s interpretation (r^2 = 0.4925). In other words, a player’s preseason ranking has little to with how they perform over the course of 82 games. Speaking of performance, the statistics I chose do not tell the entire story of how good a player is, and no statistic does. Rankings are better at predicting PER compared to VORP, one potential reason for this could be that PER favors high usage players and the best players in the NBA are used a lot (because, well, they’re good). Whereas VORP relies on box score data which isn’t as usage driven. If you need to take something away from this article, maybe take away that in the past couple of seasons ESPN’s player rankings have been the best indicator of success (compared to others).
Here is a list of the rankings with stats (please note that all statistics are from Basketball reference). CBS Rankings, ESPN rankings, and Sports Illustrated Rankings.
